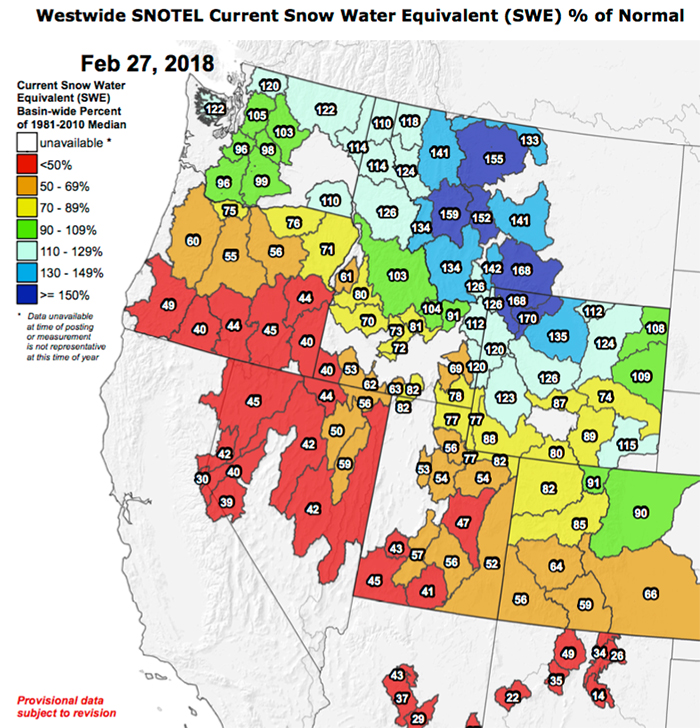
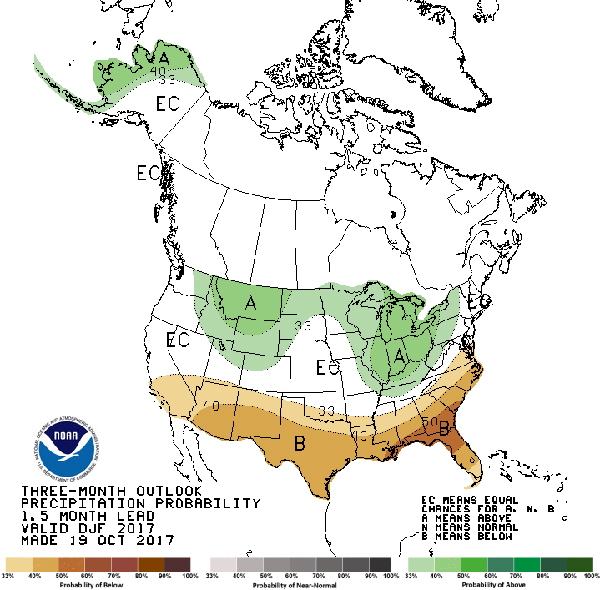
For those who paid attention to the forecast back in October that NOAA’s Climate Prediction Center made (we posted it here in The Odds of A LaNina Winter Keep Going Up), the current Snow Water Equivalent (SWE) map for the Northern Rockies, hot off the presses this morning, looks remarkably like the precipitation prediction map from November (second image below) and almost a textbook representation of a typical La Nina pattern.
Honing in on Montana and Wyoming (below), current SWE data looks very good, recognizing in particular that March, April, and May storm cycles typically lay in significant contributions to snowpack, especially in La Nina cycles. In fact, if even average spring snowfall and snowpack build happens over the next few months, it’ll be time to cue up the “there’s too much snow in the hills” chatter.
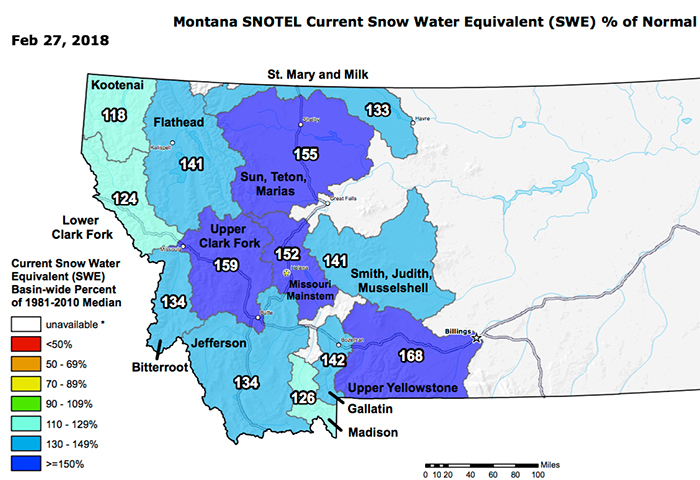
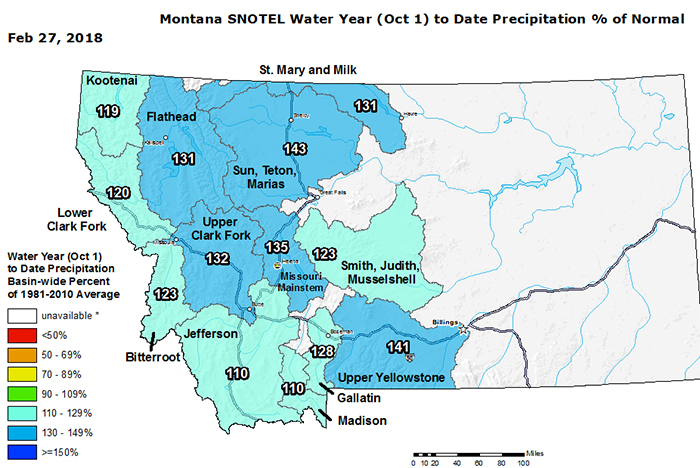
Speaking of Montana, Water Year data (percent of normal) as of yesterday is graphed by basin below (the Water Year runs from 1 October); impressive at this point in the season to say the least.
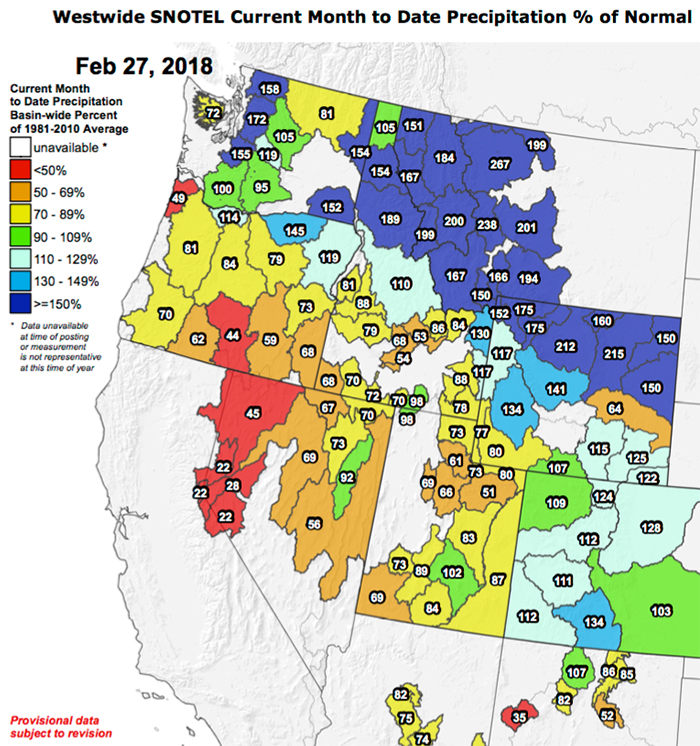
And one additional chart of interest is the one below – Month to Date Precip as a % of Normal for the West by Basin. Northern Idaho, Western Montana, and most of Wyoming have been getting pounded, though Colorado and Oregon fared much better than the 3 months prior in terms of precip.
Impressively, that happens to match up pretty well with the Climate Prediction Center’s one month outlook for March as well here. The La Nina is still in place though is forecast to break down in late spring, returning to ENSO neutral conditions – read more about it here in the latest ENSO discussion from NOAA.