We’re moving into that time of year when shoveling snow and driving snow-packed and icy roads loses the sexy allure it had back in late November and early December.
Despite a growing disdain for late winter, fly fishers of the Northern Rockies begin to pay more attention to the snow pack numbers this time of year, at least on their home waters and favorite area fisheries.
We’re certainly part of that flock which turns to the snow pack monitoring sites this time of year; technology has provided some nifty graphs and images to peruse instead of just flogging through mind-numbing spreadsheets.
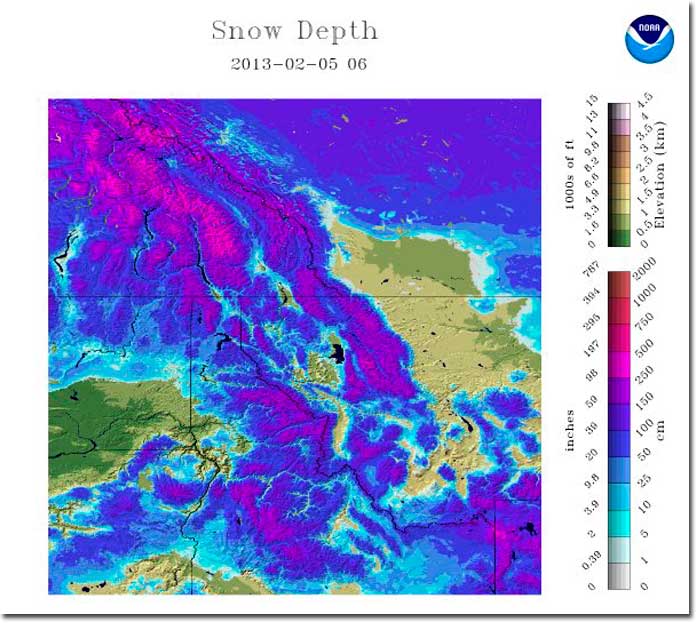
Take this one for instance; here is an image of the current snow depth across eastern Washington, Idaho, western Montana and some of the Yellowstone corner of Wyoming. I lifted that image here; the more important snow water equivalent (how much actual water does the snowpack hold) sits right beside it on the linked page above.
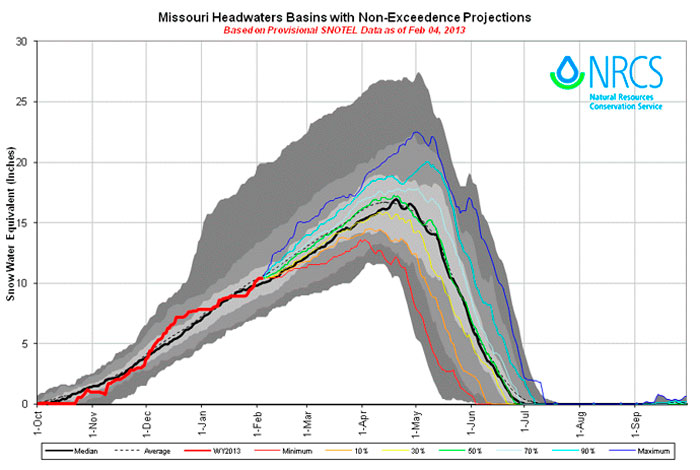
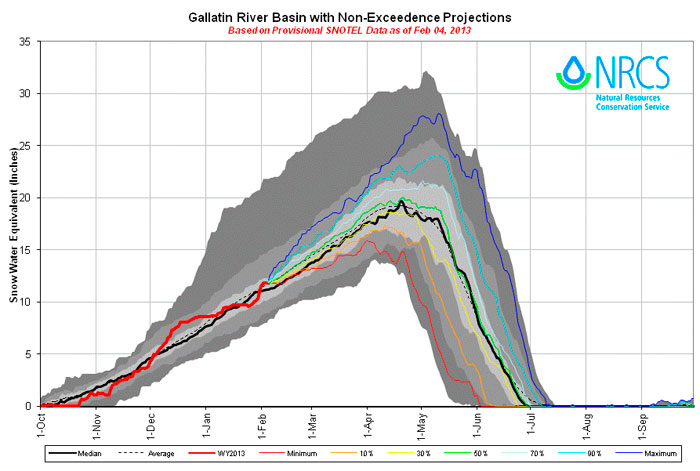
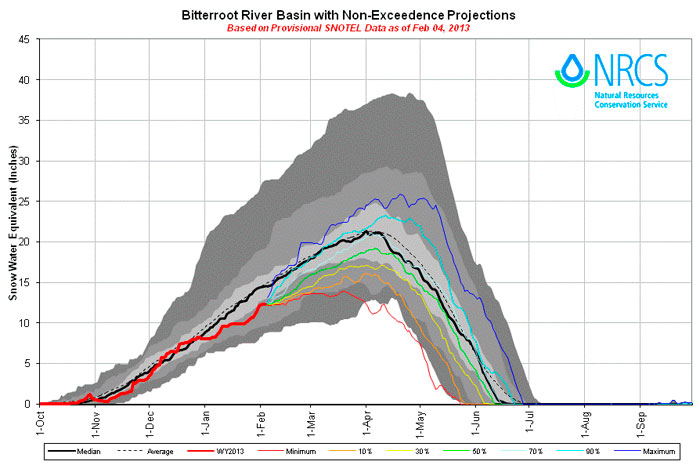
The Natural Resources Conservation Service offers a nifty graphing tool to look at snowpack trends over time, referenced to the ‘average snowfall’ and various percentages above and below average. Their Montana page is here. Note the median snow pack is the heavy black line, the current year’s the heavier red line.
Here’s the graph (run today) for the Missouri Headwaters…
For the Gallatin Basin…
And for the Bitterroot Basin…
The season’s snowpack, for these water basins at least, looks pretty decent for this time of year, though there’s a entire late winter /spring season to muddle through – which is when the fat of the snowpack is usually laid down.
Snowpack building is far from done.
Think snow.